Lab S00 — Splunk, Universal Forwarder & Stream Setup
Install Splunk Enterprise on Ubuntu, configure a Universal Forwarder on Windows 10, deploy the Splunk App for Stream, and capture your first packet stream.
Download Lab DocumentPrerequisites
This lab requires two virtual machines. Download the ISO images using the links below and set them up in your hypervisor of choice (tested on Synology VMM, but any local network environment works).
- Ubuntu 22.04 — runs Splunk Enterprise (Search Head + Deployment Server)
- Windows 10 — runs the Universal Forwarder + Splunk App for Stream
Ensure both VMs are on the same local network so they can reach each other by IP address. Note your Ubuntu VM's IP — you'll need it throughout the lab.
Introduction
Before diving in, watch Splunk's intro video to get a feel for the platform: What is Splunk?
Splunk is a big data platform that helps organizations collect, manage, and analyze machine-generated data. It uses indexes to store data, so it doesn't require a separate database.
Key capabilities:
- Data analysis — analyze data from databases, networks, web servers, and sensors; create dashboards, graphs, reports, and alerts
- Security — security monitoring, incident response, compliance, and threat hunting across cloud, on-premises, and hybrid environments
- Observability — full-stack and OpenTelemetry-native observability
- User behavior analytics (UBA) — detect anomalous user behavior
Core products: Splunk Enterprise · Splunk Cloud Platform · SOAR
Splunk indexing transforms raw data into searchable events stored in indexes.
- Data input — the indexer processes and stores incoming data; forwarders collect and send it in larger deployments
- Data storage — stored in flat files under $SPLUNK_HOME/var/lib/splunk in a structured bucket directory
- Data search — the indexer searches indexed data in response to queries, scanning only buckets within the specified time window
- Index types — Events indexes (any data type) and Metrics indexes (metric data only)
Splunk Enterprise on Ubuntu 22.04
Navigate to Splunk's homepage, open the Products dropdown, and select Free Trials & Downloads.
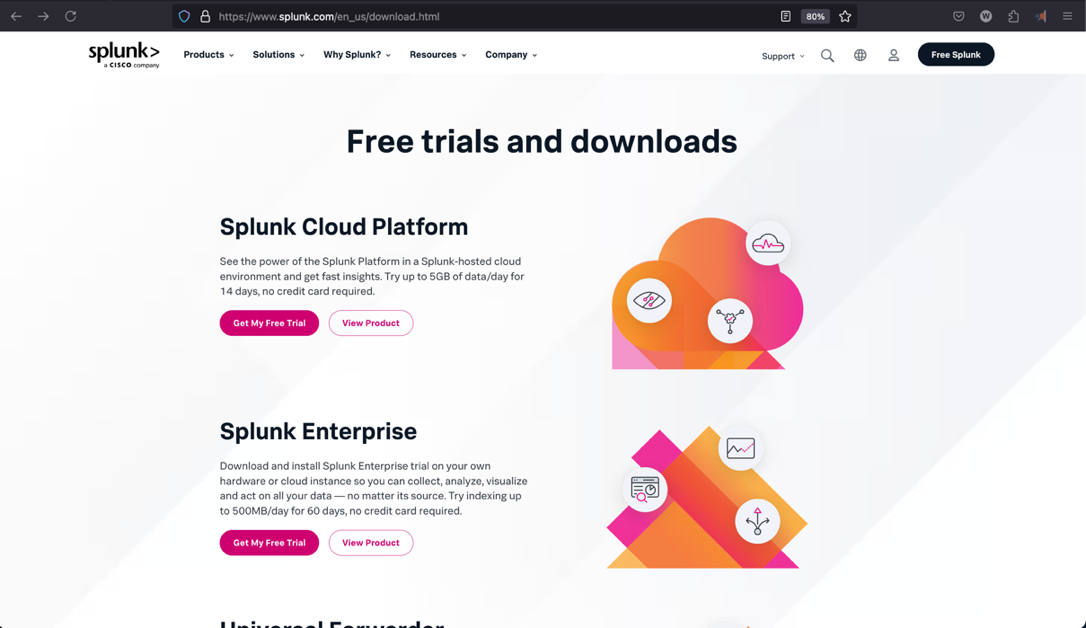
Under Splunk Enterprise select Get Free Trial. This opens a registration page for a 60-day on-premises trial.
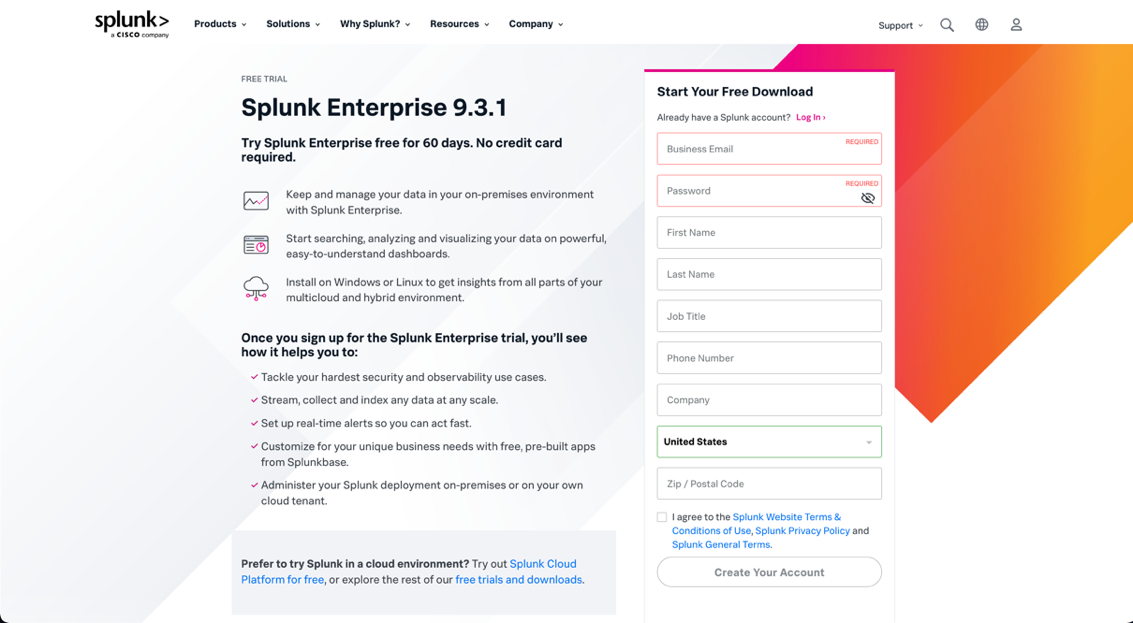
Fill out the registration form and submit. Wait for the email confirmation (this can take a few minutes), then log in with your new credentials.
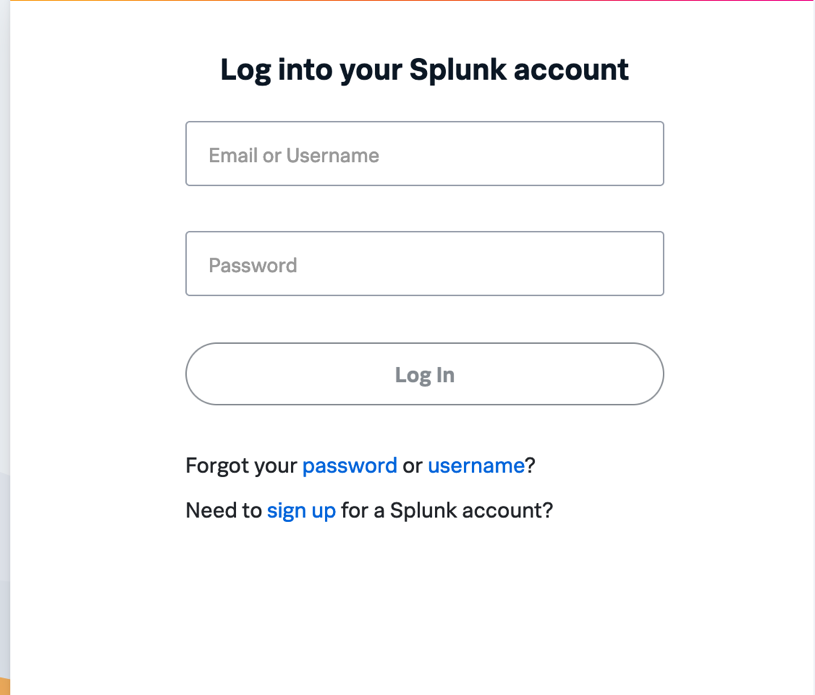
After logging in, navigate back to .
Splunk Enterprise will act as both the Search Head and Deployment Server on your Ubuntu 22.04 VM.
A search head is a core component that accepts and processes search requests and provides results to users. In a distributed deployment, multiple search heads distribute the workload and provide redundancy. For multisite indexer clusters, at least three search heads per site are required.
The Deployment Server distributes files, apps, and configurations to Splunk instances including universal forwarders. It is included with Splunk Enterprise at no extra cost and activates automatically. While the default distribution method, external deployment tools can be used instead.
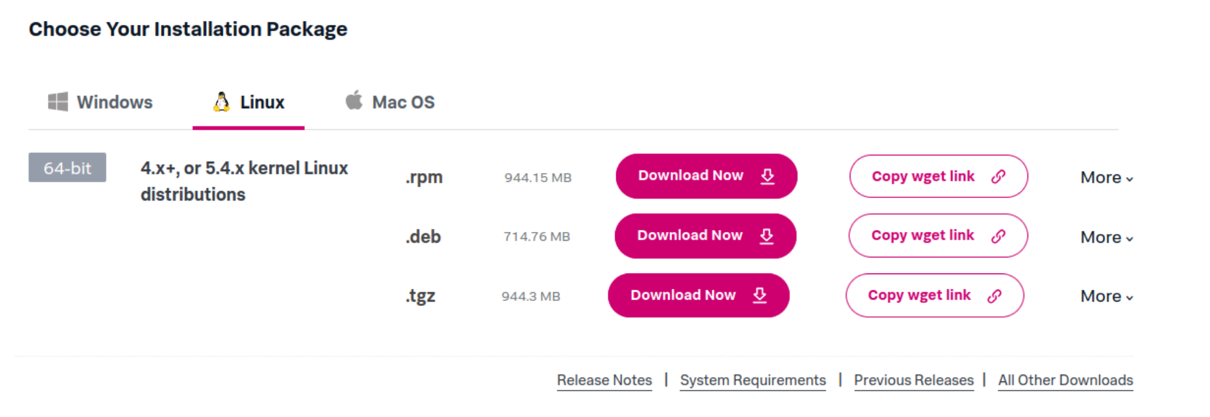
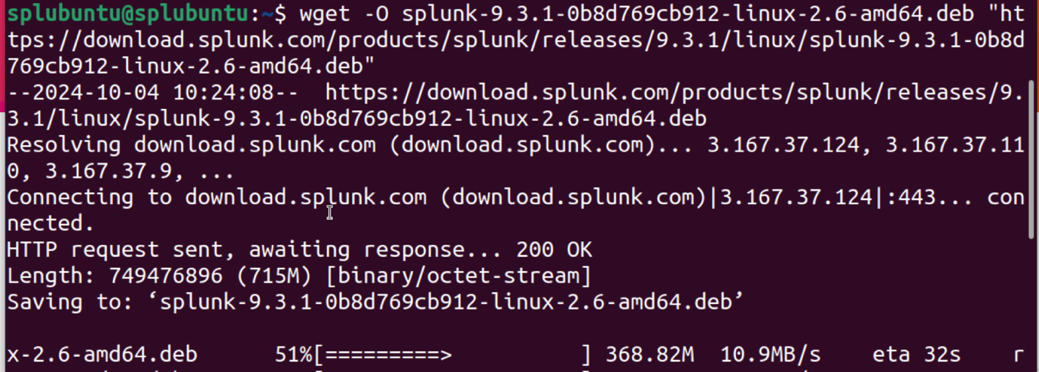
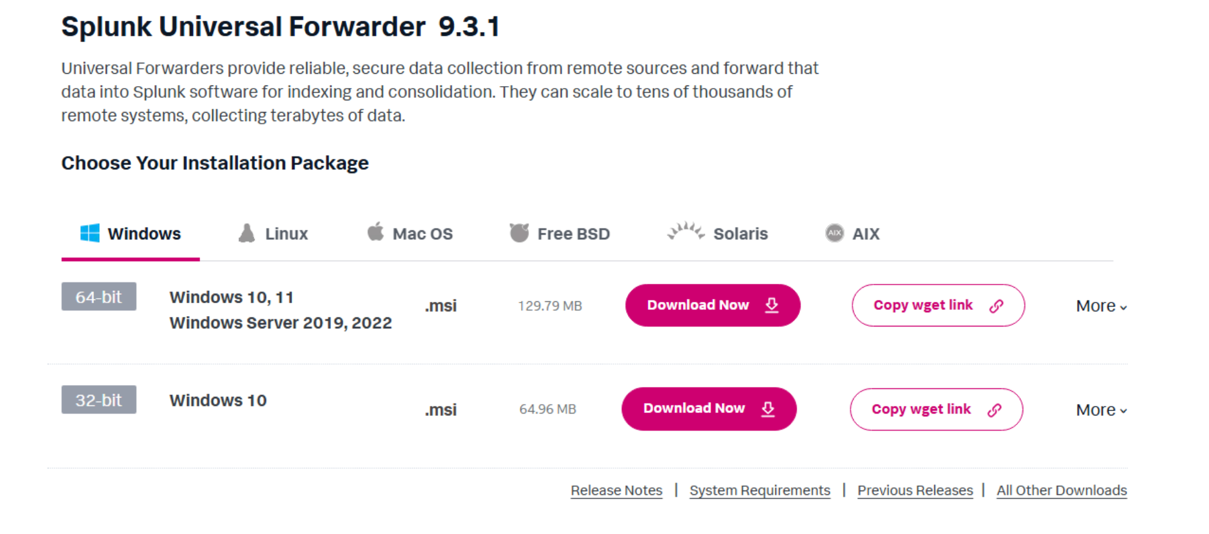
On the download page, select the Linux tab and the .deb option for Debian/Ubuntu, then click Copy wget link.
First, install curl on your Ubuntu VM:
Then paste the copied wget command into your terminal to download the package.
Move the downloaded .deb file to a dedicated artifacts folder:
Install the package. Packages must be installed as root in Linux:
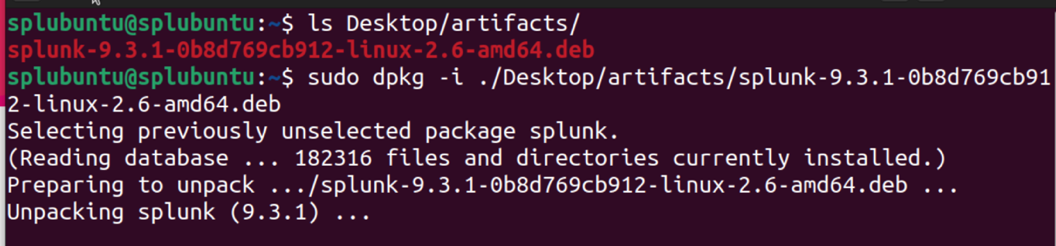
After the installation completes, confirm Splunk is in the /opt directory:
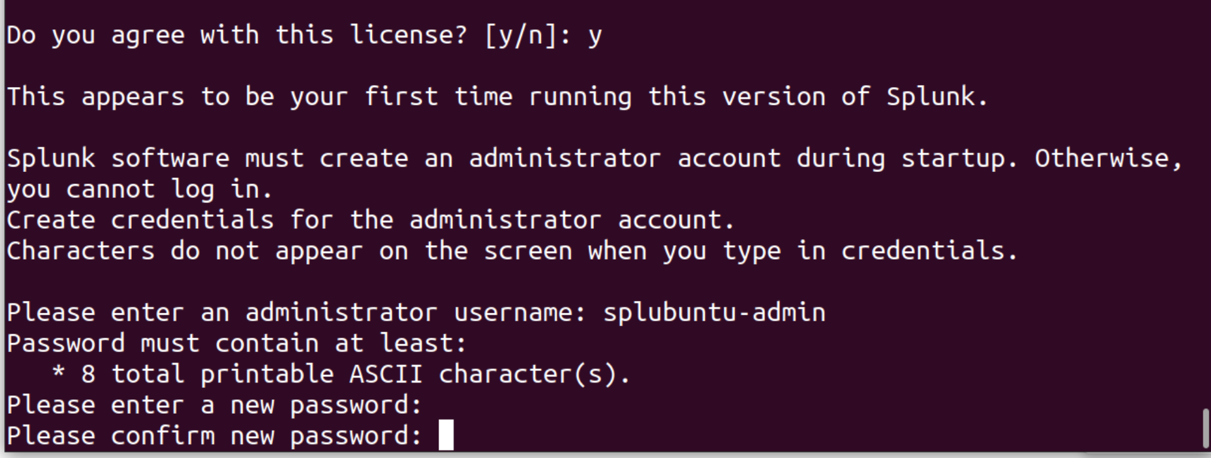
$SPLUNK_HOME will refer to /opt/splunk throughout this lab.Enable Splunk to start on boot, scroll through the license agreement (press Space to advance), and create your admin credentials when prompted:
Start Splunk as a system service:
Find your Ubuntu VM's IP address (you'll need this throughout the lab):
On any machine on your network, open a browser and navigate to:
Port 8000 is the default Splunk Enterprise Web UI port. Log in with the admin credentials you created in Step 9.
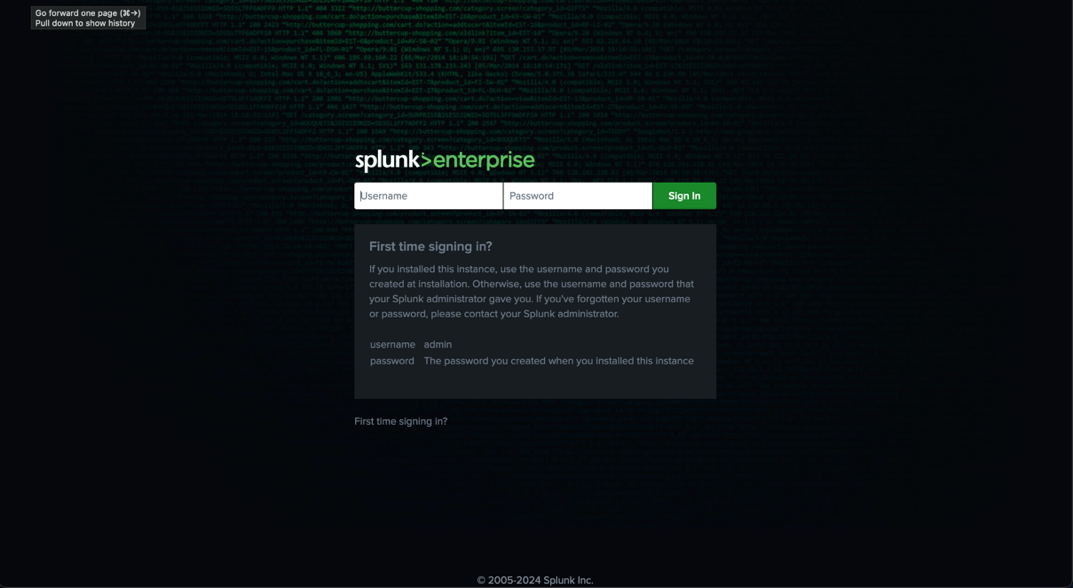
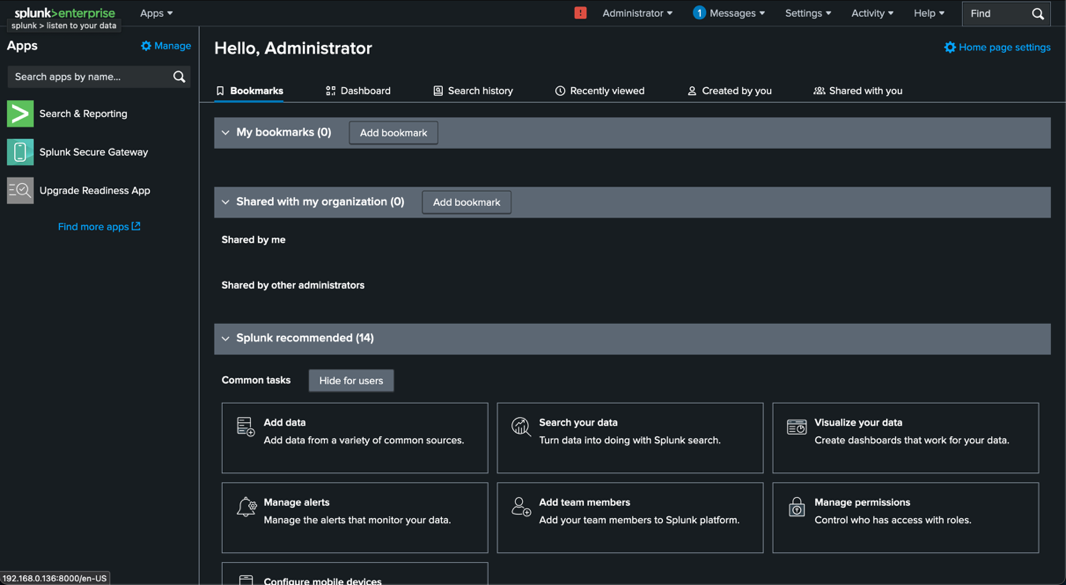
You now have access to the Splunk Enterprise Dashboard — this is where you manage Apps, search indexes, and visualizations.
Set Up a Receiving Port on Your Search Head
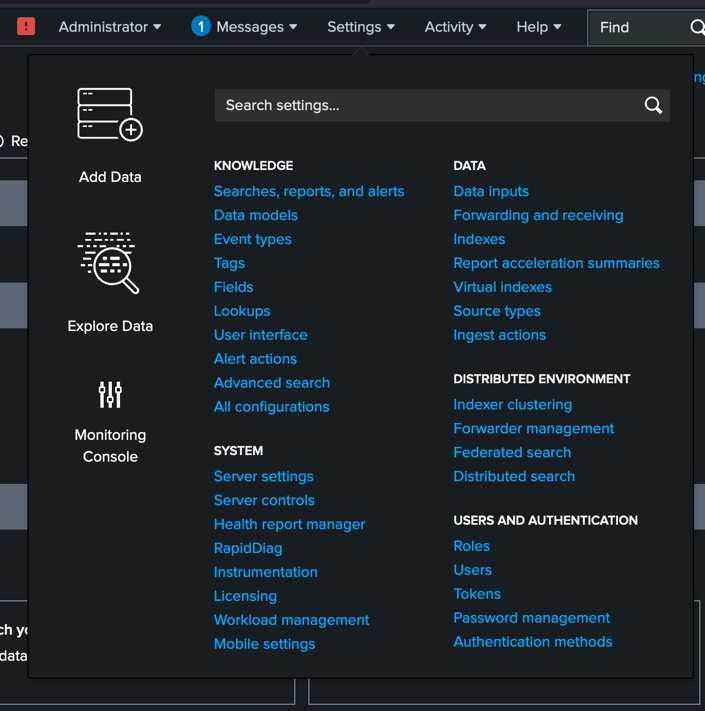
To receive input from forwarders you must configure a receiving port. In the Splunk Web UI go to .
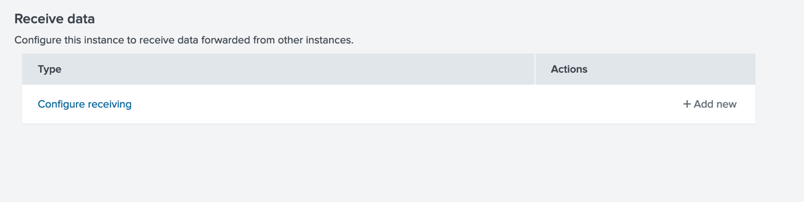
Under Receive data, select Configure receiving.
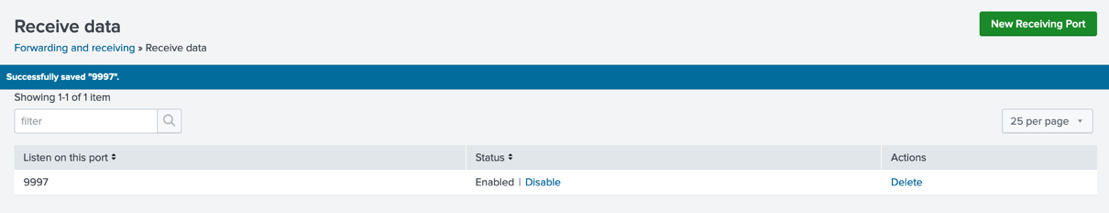
Select New Receiving Port, enter 9997 (the default Splunk receiving port), and save. Confirm the entry appears on the receiving page.
Install a Universal Forwarder (Windows 10)
On your Windows 10 VM, download the 64-bit .msi for the Splunk Universal Forwarder from the Free Trials & Downloads page (shown in the far-left column).
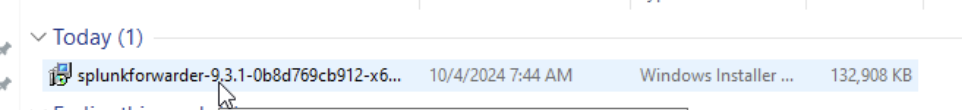
Double-click the .msi to begin the graphical installation.
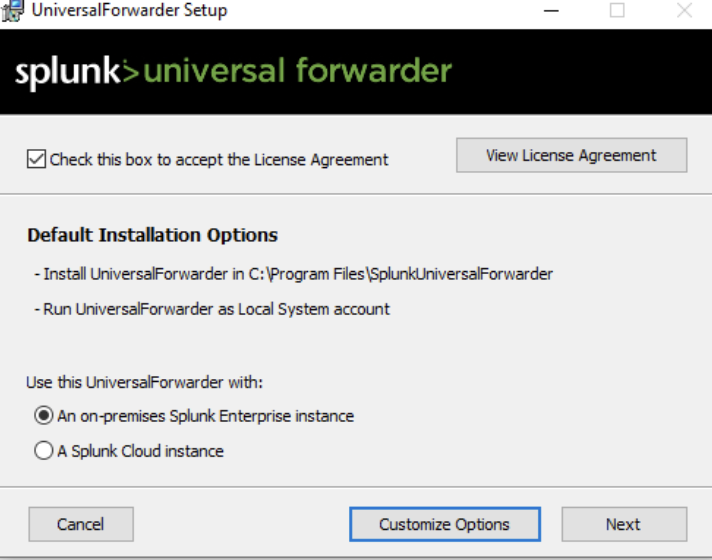
Read and accept the License Agreement.
Create a username and password for the Universal Forwarder. These credentials are separate from your Splunk Enterprise admin account but work similarly — all Splunk nodes require credentials.
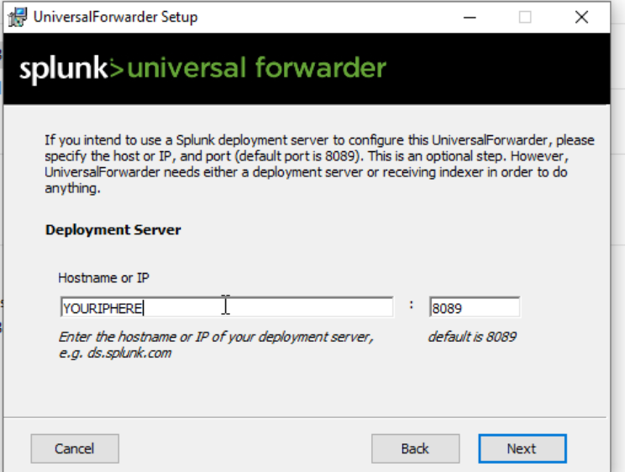
Configure the Deployment Server (your Ubuntu VM) with management port 8089. The UF will listen on this port for app and configuration updates.
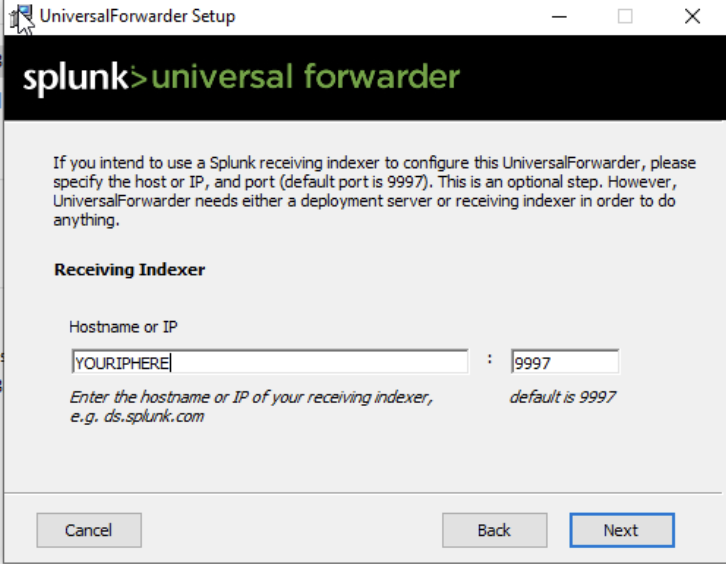
Set the Receiver Indexer (Search Head) to the same Ubuntu IP with port 9997 — the receiving port you configured earlier.
After installation, verify the forwarder is running. Navigate to the UF bin directory and check status:

$UFHOME refers to C:\Program Files\SplunkUniversalForwarder throughout this lab.Splunk App for Stream
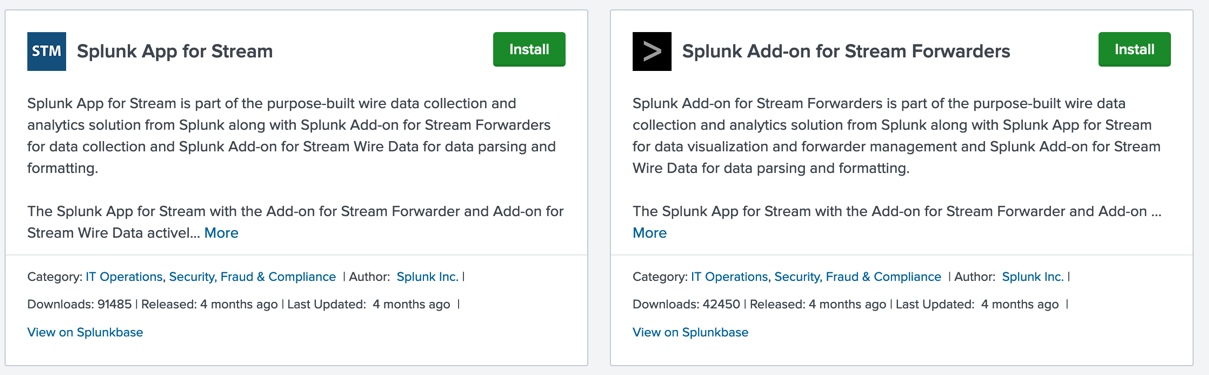
In the Splunk Server Web UI, open the Apps dropdown and select Find More Apps. Search for Stream.
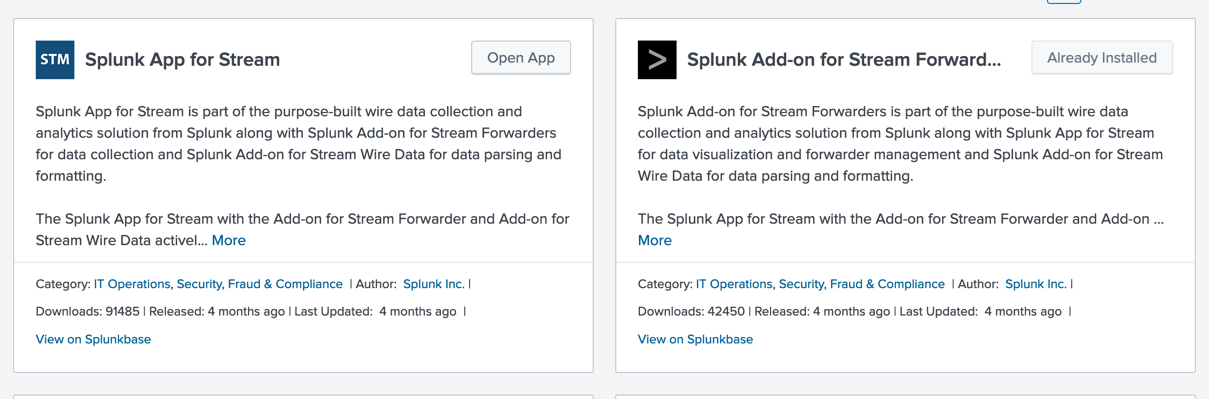
Install Splunk App for Stream first, then Splunk Add-on for Stream Forwarders. The Add-on will prompt a server restart — restart and wait, then log back in.
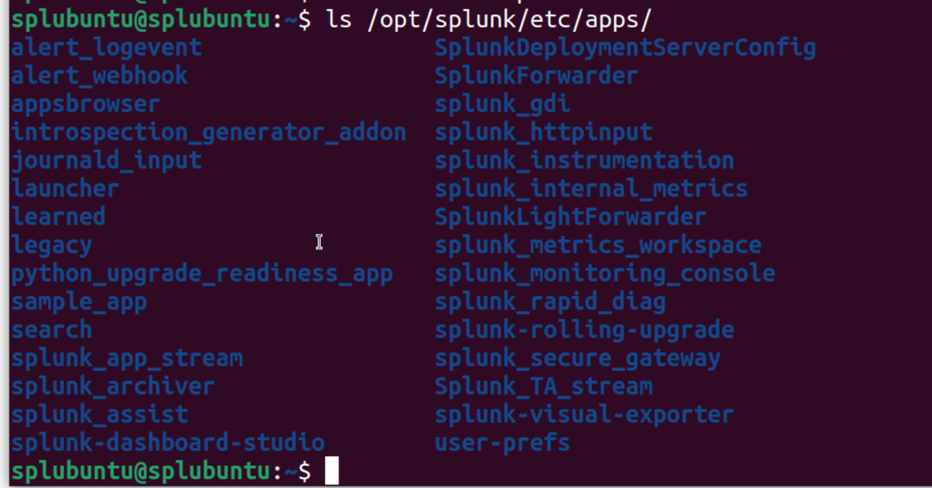
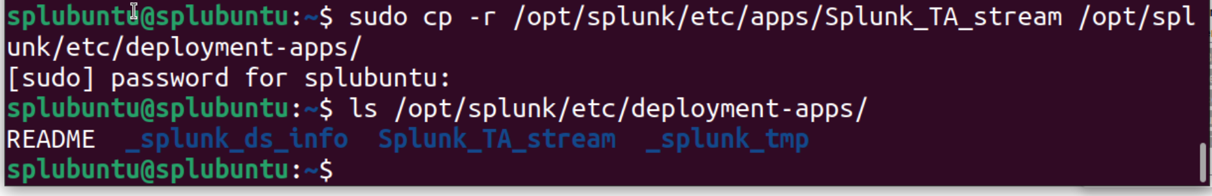
Confirm both apps are installed. Apps are always located at $SPLUNK_HOME/etc/apps. You should see splunk_app_stream and Splunk_TA_stream in that directory.
To deliver the Stream add-on to your Windows forwarder, copy it to the deployment-apps folder on your Ubuntu VM:
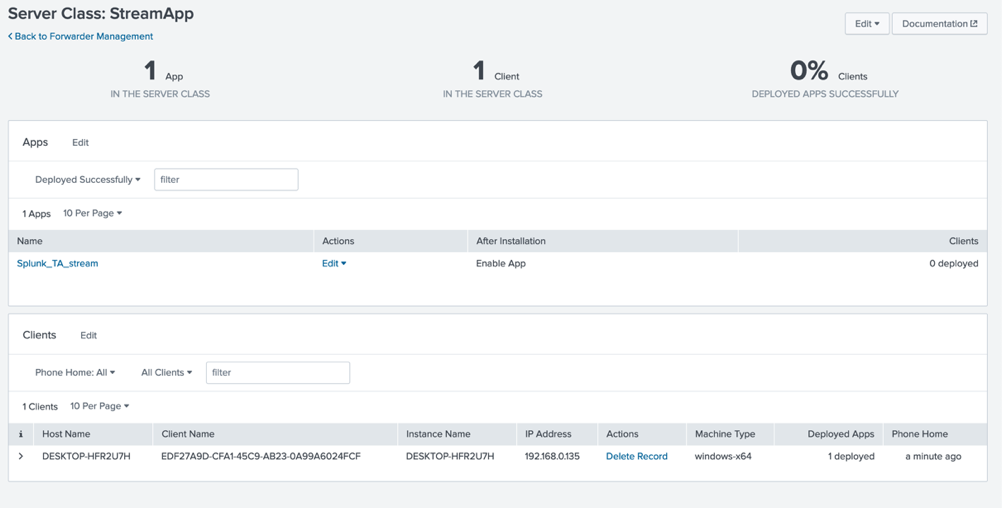
Back in the Splunk Web UI, create a server class to define which apps are delivered to which forwarders. Go to .
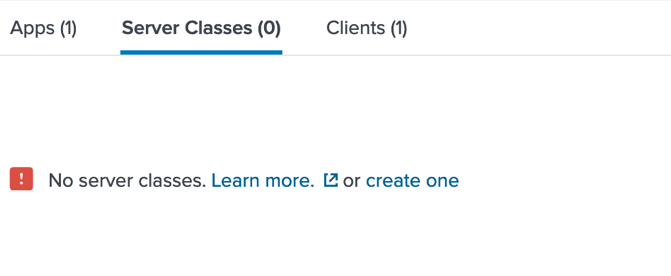
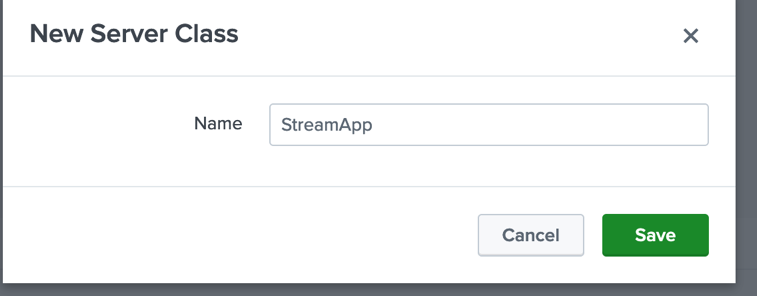
Select Create one and give it a name (e.g. StreamApp).
Under Add Apps, select Splunk_TA_stream and save. If the interface sends you away, navigate back via and select Edit — your app selection will have saved.
Under Clients, select Add Clients, add your Windows 10 VM to the Include List, and save.
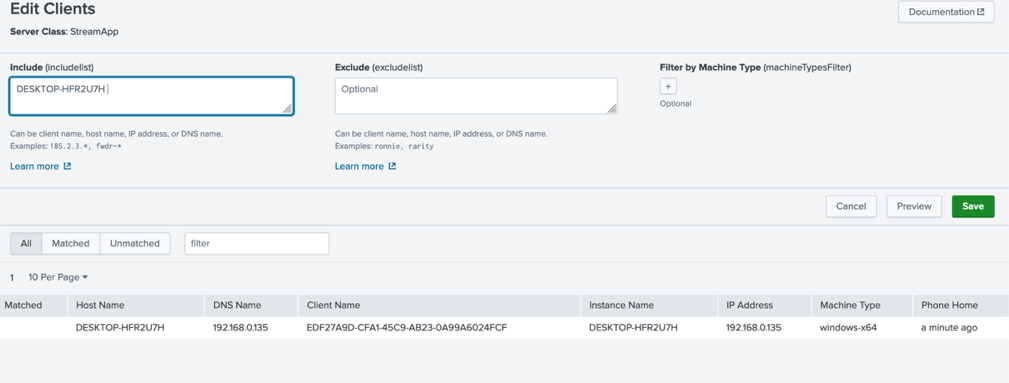
Select Preview to return to the server class page.
Configure the Stream token. Go to . Skip or take the tour.
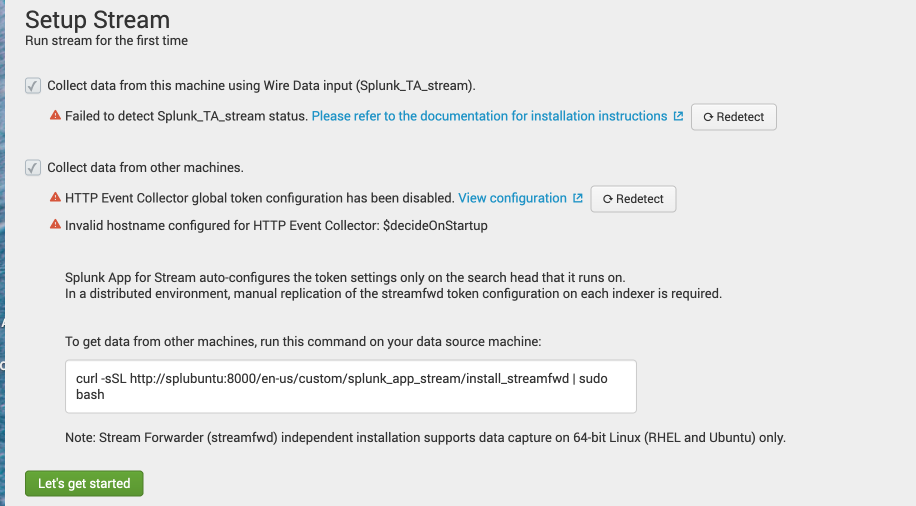
Check both boxes, then select View configuration next to the HTTP Event Collector global token.
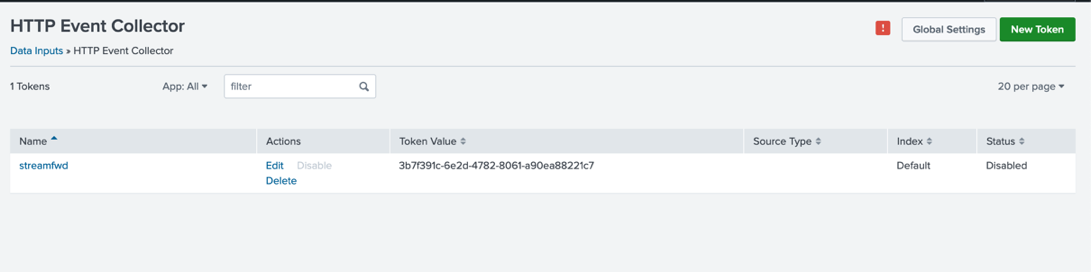
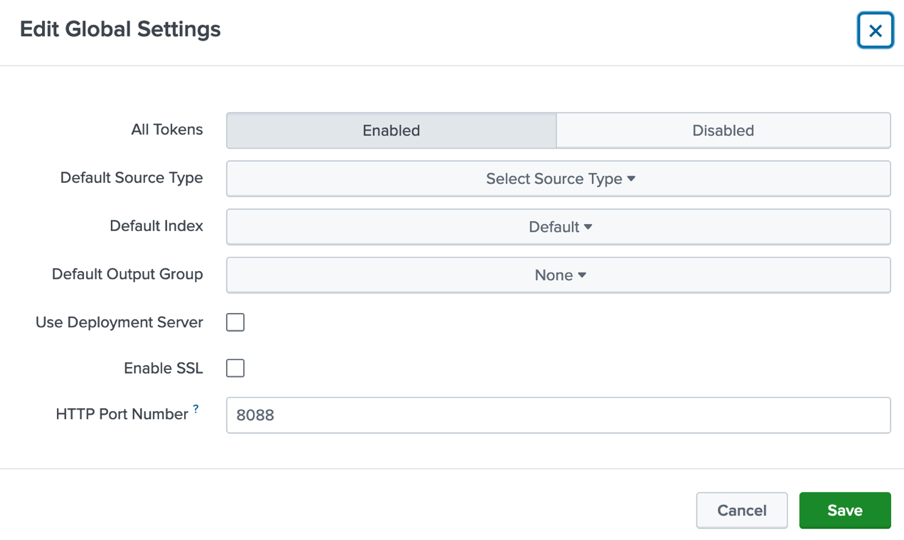
The token status will show as disabled. Select Global Settings, enable All Tokens, and disable SSL.
Go back to Splunk Stream and confirm the token configuration is now enabled.
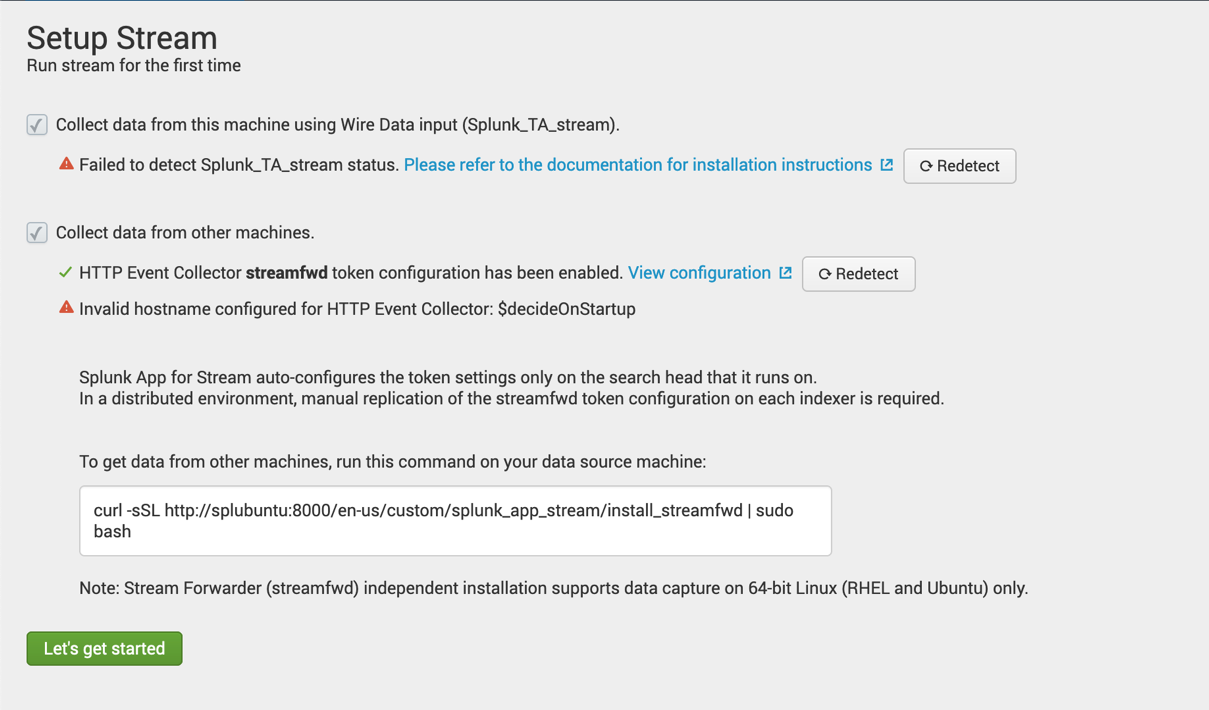
Ignore any other warnings for now and select Let's get started. You should already be receiving data from the Splunk Enterprise Search Head.
Universal Forwarder Configuration for Splunk Stream
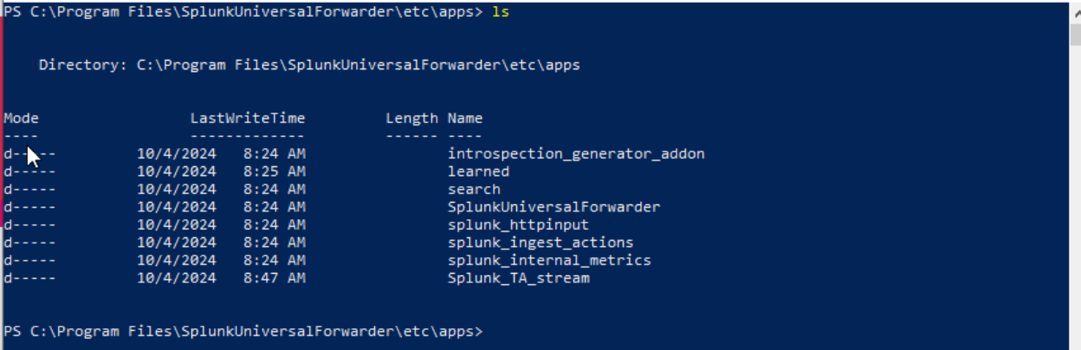
On your Windows 10 VM, confirm Splunk_TA_stream was deployed to $UFHOME\etc\apps. The deployment server should have pushed it automatically.
Inside Splunk_TA_stream, locate the npcap installer under the windows_x86_64 folder:
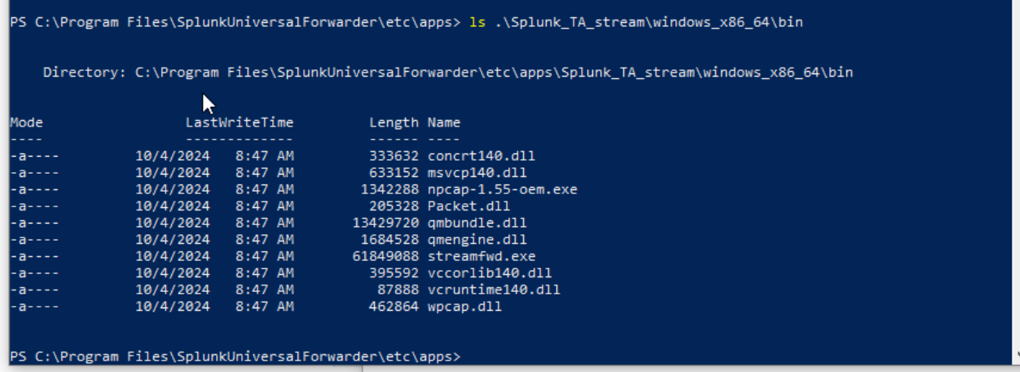
Run the installer from the command line or double-click it in File Explorer:
Follow the GUI steps. Check both boxes:
- Support raw 802.11 traffic
- WinPcap API compatible mode
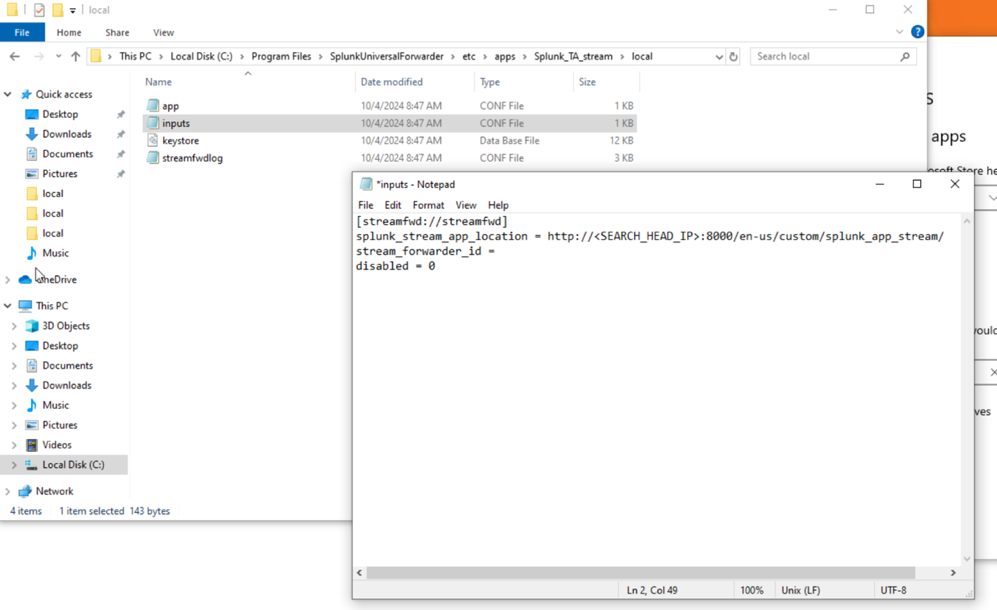
Open Notepad as Administrator, then go to . Navigate to:
Change the file type filter to All Files and open inputs.conf.
Find the line with localhost and change it to your Search Head's IP address. You can also remove the stream_forwarder_id line.
Save the file, then restart the Universal Forwarder:
You may also need to restart the Splunk Server via in the Web UI.
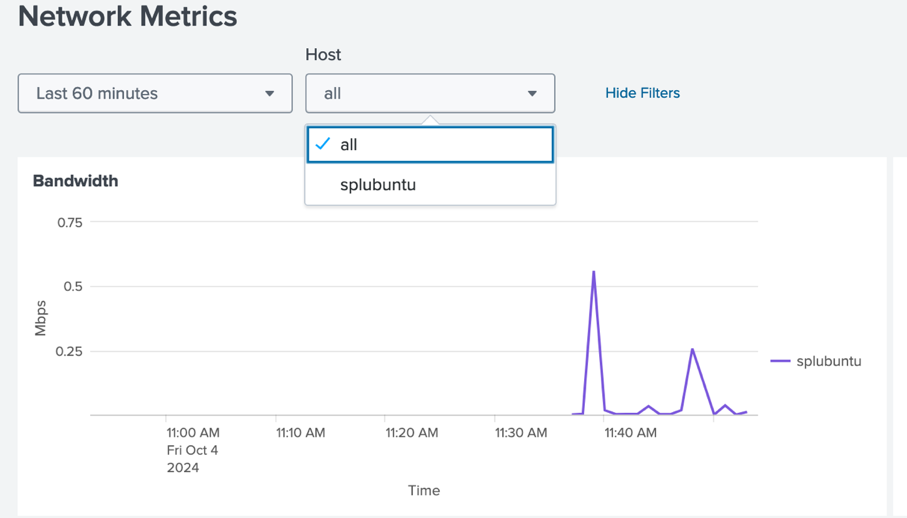
You should now be receiving data from your Windows host to the Splunk Enterprise Stream App.
Packet Stream with Stream App
Create a new index to store packet data. In the Web UI go to . Name it packet_stream, select Splunk App for Stream as the application, and leave remaining settings at their defaults.

Go to .
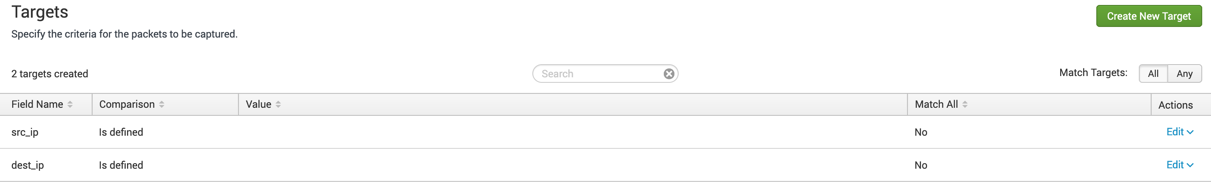
Select TCP Protocol and name the stream tcp_stream. Click Next and define your targets — for generic capture, set any source IP and any destination IP. This captures all TCP traffic from the host and can be refined later.
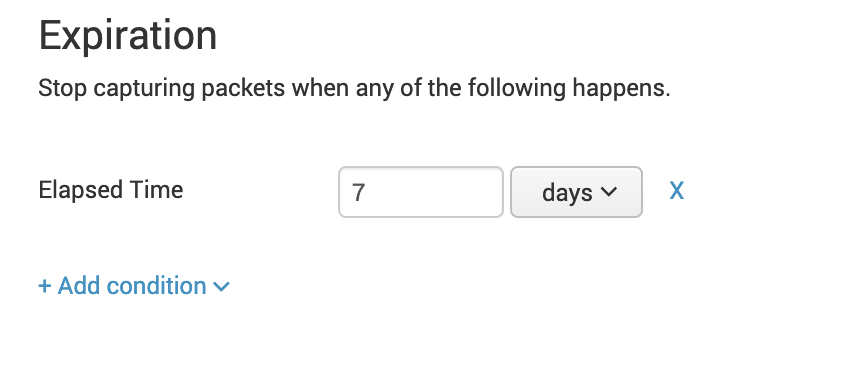
Set the stream expiration to 1 week. With a 500 GB index limit, a single host is unlikely to exceed this in one week.
Leave the default fields. Under Index, select packet_stream, enable the stream, and add it to the default group.
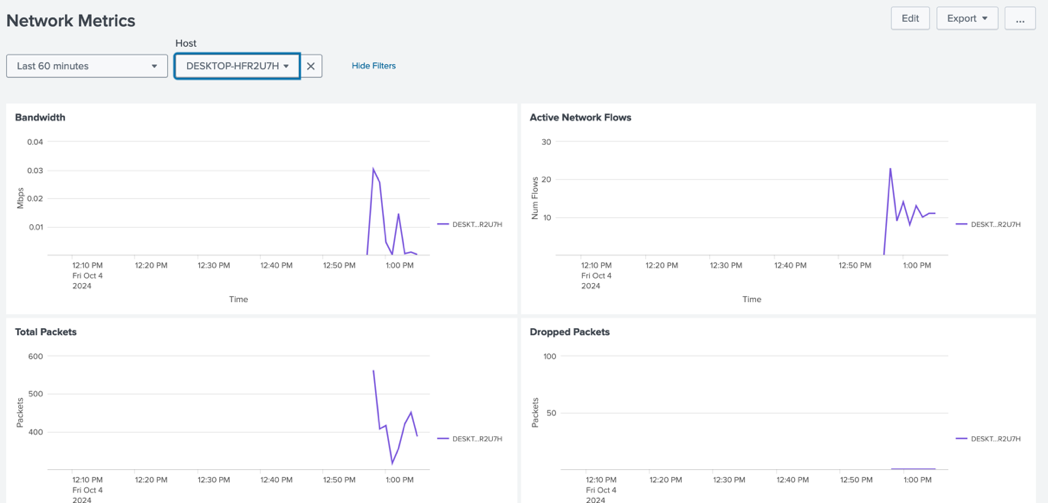
Navigate to and run your first query:
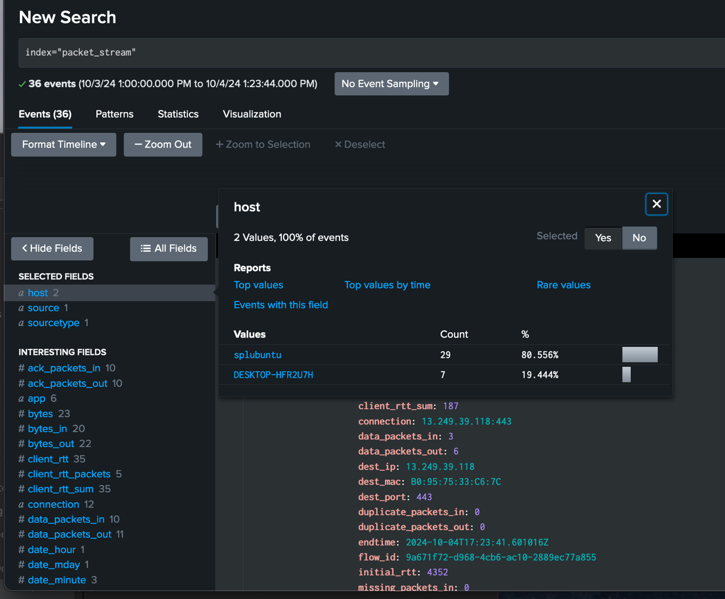
You're now ingesting live network packet data. From here you can use Splunk's Search Processing Language (SPL) to parse, filter, and visualize network traffic events to identify potential anomalies.
For more on SPL, see the Getting Started with Search documentation.